
- Break even quantity
- Break even revenue
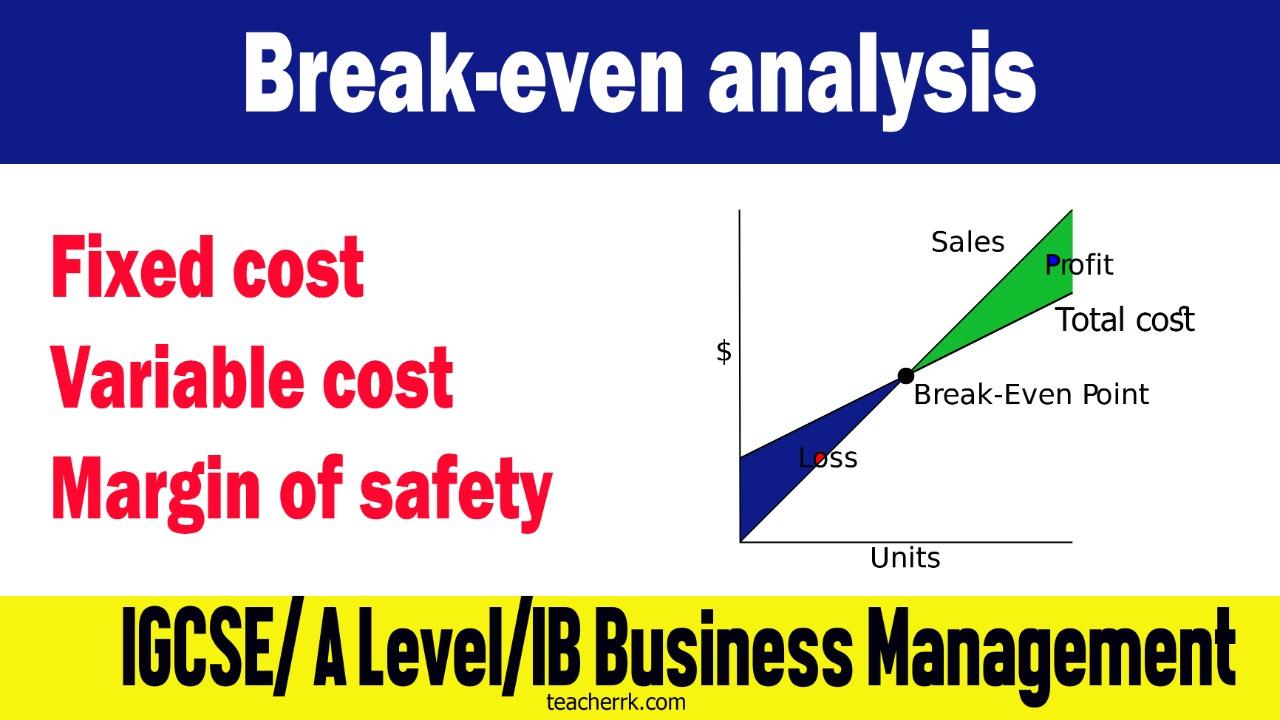
- Margin of safety
- Profit
You are given the following cost and revenue details
| Business A | Business B | |
| Fixed cost | $ 20 000 p.a. | $ 40 000 p.a. |
| Variable cost | $120 per unit | $ 60 per unit |
| Selling price | $ 200 per unit | $ 100 per unit |
| Current output (Annual) | 400 units | 1200 units |
Questions:
- Identify five assumptions of break even graph [ 2 marks]
- Calculate unit contribution for both Business A and Business B [ 2 marks]
- Calculate break even quantity for both Business A and Business B [ 4 marks]
- Calculate break even revenue ($) for both Business A and Business B [ 4 marks]
- Calculate margin of safety (units) for both Business A and Business B [ 2 marks]
- Calculate profit at the current level of output for both Business A and Business B [ 4 marks]
- Calculate the number of units to be sold to make 20 % more profit from the current level of profit [ 6 marks]

1 thought on “Break-even analysis – Worksheet 29: Meru Limited”
Comments are closed.