Table of Contents
Introduction
Every project involves several activities that must be completed within a specific period. A Gantt Chart helps managers and teams plan these activities, understand their timing, and monitor the progress of a project.
Meaning of Gantt Chart
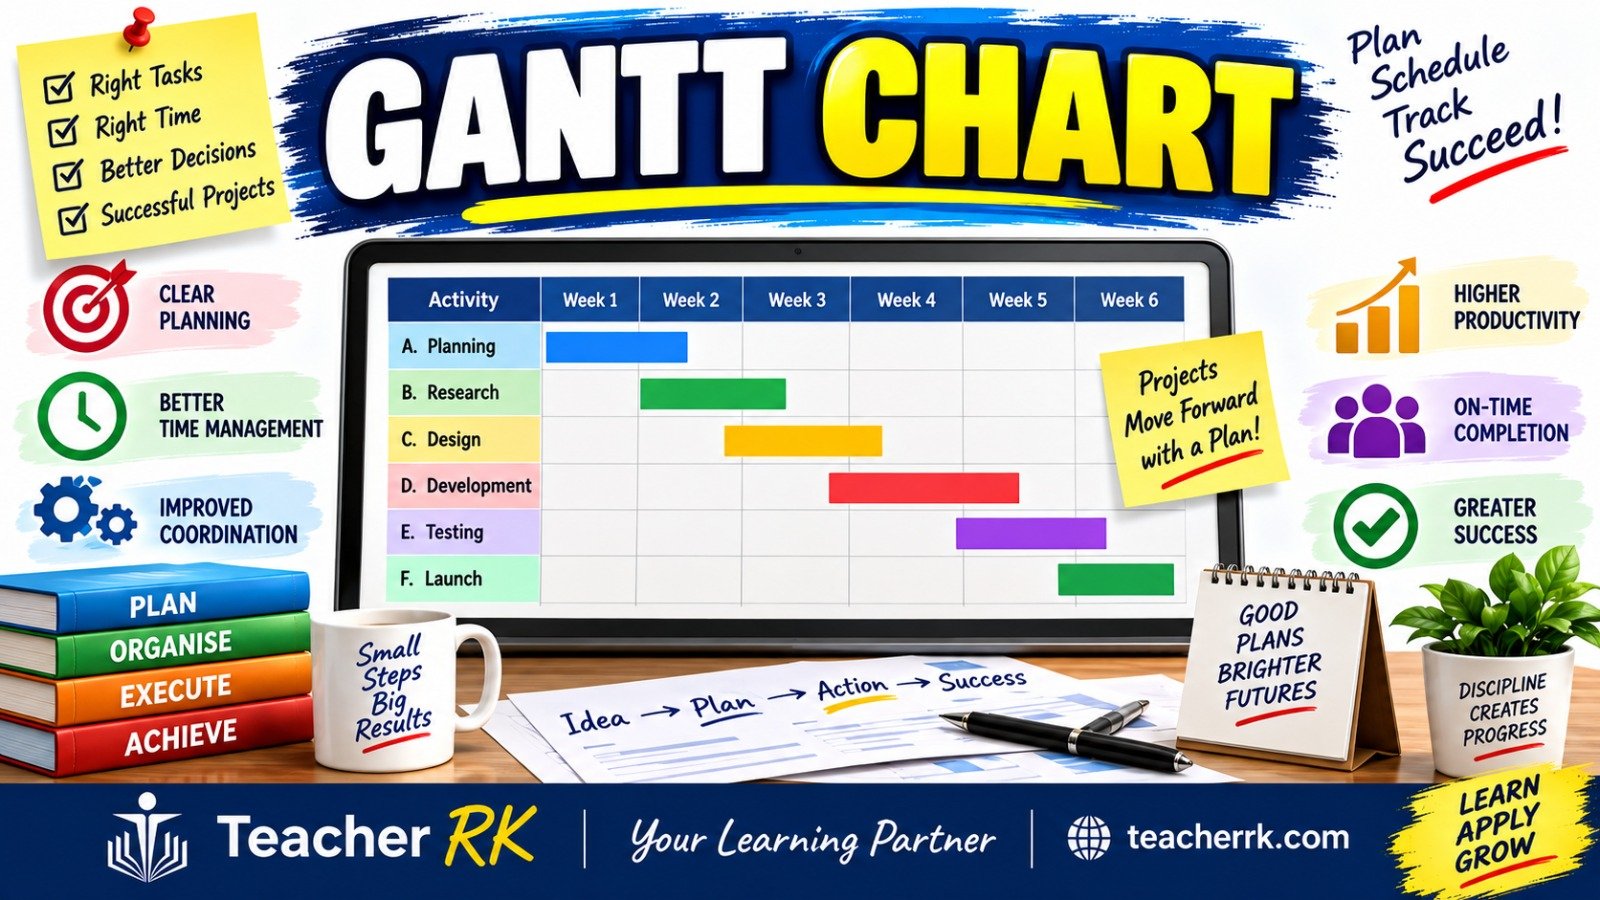
A Gantt Chart meaning is a visual project management tool that represents project activities against time.
It usually consists of:
- Activities or tasks listed vertically.
- Time periods shown horizontally.
- Horizontal bars showing the planned start and completion time of each activity.
In simple words, a Gantt Chart shows what has to be done, when it has to be done, and how long it will take.
Benefits and limitations of a Gantt Chart
| Benefits of a Gantt Chart | Limitations of a Gantt Chart |
| 1. Easy to understand: A Gantt Chart presents complex project information visually, making it easier for managers and employees to understand the project schedule.· 2. Helps in planning: It helps identify what activities need to be completed, their sequence, and the time required for each activity.· 3. Helps Monitor Progress: Actual progress can be compared with the planned schedule. This makes it easier to identify delays and take corrective action. · 4. Improves Coordination: Team members can clearly see when their activities should begin and how their work fits into the overall project. | 1. Can Become Complex: Large projects with hundreds of activities can make the chart difficult to read and manage.· 2. Time-Consuming to Prepare: Preparing a detailed Gantt Chart requires careful identification, sequencing, and estimation of activities.· 3. Frequent Changes Require Updates: If deadlines, resources, or activities change, the Gantt Chart needs to be updated regularly.· 4. Does Not Always Show Resource Constraints Clearly: A Gantt Chart mainly focuses on time and activities. It may not clearly show whether sufficient workers, money, equipment, or other resources are available. |
Steps in Constructing a Gantt Chart
Step 1: Identify the Project: Clearly define the project and its objective.
Example: Launching a new product.
Step 2: List All Activities: Break the project into smaller tasks.
For example:
- Market research
- Product design
- Production
- Packaging
- Advertising
- Product launch
Step 3: Determine the Sequence: Decide which activities must be completed before others can begin.
For example, product design may need to be completed before production begins.
Step 4: Estimate the Duration: Estimate how long each activity will take.
For example:
- Market research – 2 weeks
- Product design – 3 weeks
- Production – 2 weeks
Step 5: Set the Time Scale: Divide the horizontal axis into suitable time periods such as days, weeks, or months.
Step 6: Draw the Activity Bars: List activities vertically and draw a horizontal bar against each activity to show its starting date, duration, and completion date.
Step 7: Review and Monitor: Compare actual progress with the planned schedule and update the chart for project whenever necessary.
Gantt Chart- an example
Stay Well developers have signed for a single-story building construction contract. The following activities have been identified gantt chart example.
A. Preparing the ground – 2 days
B. Laying foundation – 2 days
C. Construction of Pillars – 4 days
D. Construction of walls – 5 days
E. Roofing – 2 days
F. Interiors – 2 days
G. Final touch/finishing – 2 days
Construct a Gantt chart to calculate the number days needed to complete the project
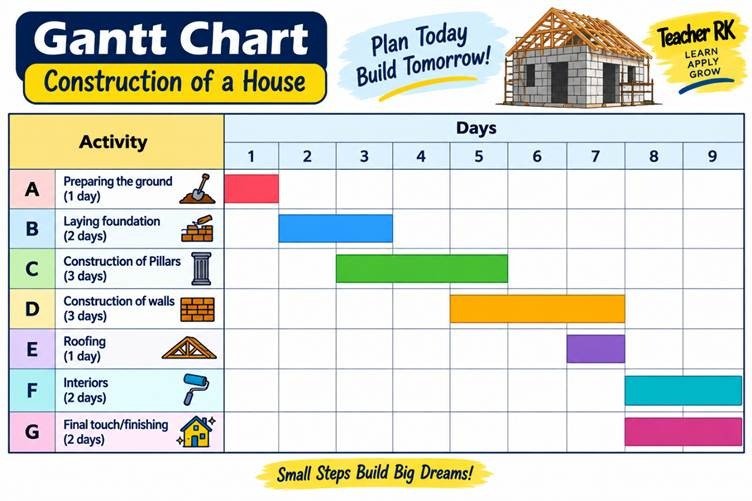
As per the Gantt Chart, it takes 9 days to complete the project
Higher-order thinking questions for discussion
a) A project is running behind schedule. How could a Gantt Chart help the manager identify the cause of the delay?
b) If two activities require the same employee at the same time, what problem might arise? How could the Gantt Chart help solve it?
c) Do you think a Gantt Chart is more useful for a small project or a large project? Justify your answer.
d) Suppose a project has unlimited money but very limited time. How would you modify the project schedule using a Gantt Chart?
e) A manager refuses to update the Gantt Chart after making changes to the project. What problems could this create?
f) Can a project be completed on time even if the Gantt Chart shows delays in some activities? Explain with an example.
| Quick Takeaway: A Gantt Chart is a visual roadmap that helps a business plan, schedule, coordinate, and monitor project activities over time. |
Download this revision notes | Download classroom activity sheet