

Table of Contents
Introduction
Picture this: you’ve just opened a small bakery. The rent, the oven and your baker’s salary have to be paid every month, whether you sell ten cakes or a hundred. So how many cakes do you actually need to sell before you stop losing money?
That’s the question every manager asks before launching a new product, and break-even analysis is the tool that answers it. In this lesson, we’ll go through the formulas step by step, work out the margin of safety and target profit output, and look at how to use them in your IB Business Management exam answers.
What is Break-even Analysis?
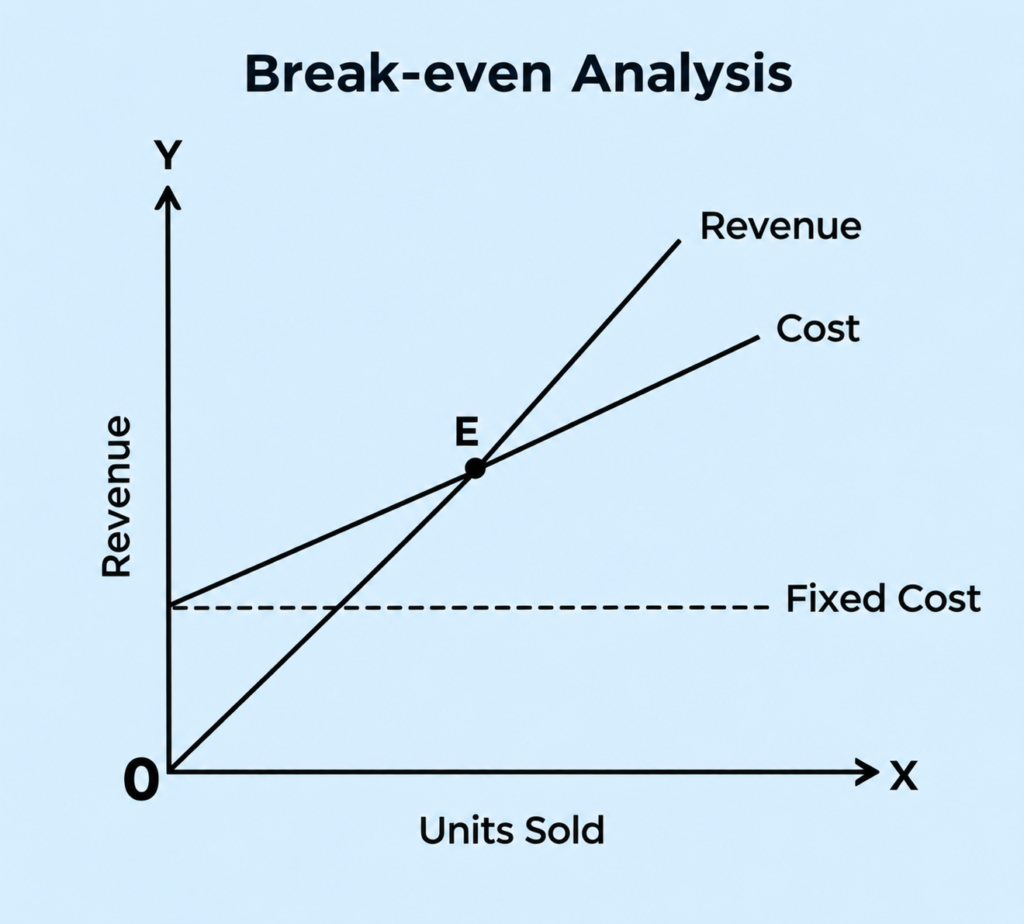
Break even analysis meaning is a financial technique that shows how much a business must sell for its total revenue to equal its total costs. At this break-even point, the business makes no profit and no loss. It can be measured in units sold or in sales revenue.
In simple words, it answers one question: how much do we need to sell just to cover our costs? Every unit sold below that level adds to the loss, and every unit sold above it adds to profit. We’ll look at the formula in the break-even quantity section below.
Key takeaways
Managers use it to set prices, plan sales targets, judge new projects and measure risk through the margin of safety.
- The break-even point is where total revenue equals total costs.
- It depends on three things: selling price, variable cost per unit and fixed costs.
- A higher selling price, lower variable costs or lower fixed costs all lower the break-even point.
Fixed Costs
Fixed costs are business costs that remain unchanged regardless of the level of production or sales. These costs must be paid even if no goods or services are produced.
Examples: Factory rent, insurance premiums, salaries of administrative staff, and property taxes
Variable Costs
Variable costs are costs that change directly with the level of production or sales. As output increases, variable costs increase, and as output decreases, they decrease.
Examples: Raw materials, direct labour (paid per unit), packaging and sales commissions
Total Cost
Total cost is the total amount spent by a business to produce a given level of output. It is the sum of fixed costs and total variable costs.
| Formula: Total Cost = Fixed Costs + Total Variable Costs |
Example:
A business has:
- Fixed costs = $10,000
- Variable cost per unit = $5
- Production = 2,000 units
Total Variable Cost = $5 × 2,000 = $10,000
Total Cost = $10,000 + $10,000 = $20,000
Unit Contribution
Unit contribution is the amount each unit sold contributes towards covering fixed costs and, after the break even point formula is reached, generating profit.
| Formula: Unit Contribution = Selling Price per Unit − Variable Cost per Unit |
Example
Selling price = $20 per unit
Variable cost = $12 per unit
Unit Contribution = $20 − $12 = $8 per unit
Each unit sold contributes $8 towards covering fixed costs and profit.
Total Contribution
Total contribution is the total amount contributed by all units sold towards covering fixed costs and generating profit.
| Formula: Total Contribution = Unit Contribution × Number of Units Sold |
Example
Unit contribution = $8
Units sold = 3,000
Total Contribution = $8 × 3,000 = $24,000
If fixed costs are $20,000, the business earns a profit of $4,000.
How Do You Calculate the Break-Even Point?
The break-even Point (also called the break-even quantity ) is the number of units a business must sell so that total revenue equals total costs. At this point, the business makes no profit and no loss.
Break Even Analysis Formula
| Break-even quantity = Total Fixed Cost/Selling price per unit – Variable cost per unit |
| Example: A business has: Fixed costs = $20,000 Selling price per unit = $50 Variable cost per unit = $30 Break-even quantity = $20,000 ÷ $20 = 1,000 units Interpretation: The business must sell 1,000 units to cover all its costs. Selling more than 1,000 units results in a profit, while selling fewer than 1,000 units results in a loss. |
Margin of Safety
The margin of safety (MOS) is the difference between the actual (or expected) sales and the break-even sales. It shows how much sales can fall before the business starts making a loss.
A higher margin of safety indicates lower business risk, while a lower margin of safety indicates higher risk.
| Formula: Margin of Safety (units) = Actual (or Forecast) Sales − Break-even Sales |
| Example: A business has: Break-even quantity = 1,000 units Actual sales = 1,400 units Margin of Safety (units) = 1,400 − 1,000 = = 400 units |
Profit or loss
In break-even analysis, profit or loss is determined by comparing the total contribution with the fixed costs.
· If total contribution is greater than fixed costs, the business earns a profit.
· If total contribution is equal to fixed costs, the business is at the break-even point (no profit and no loss).
· If total contribution is less than fixed costs, the business incurs a loss.
There are three ways to calculate profit:
| Formula 1 | Profit = Total revenue – ( Total fixed cost + Total variable cost) |
| Formula 2 | Profit = Total contribution – Total fixed cost |
| Formula 3 | Profit =Margin of safety ( Quantity) X Unit contribution |
| Example : Calculating profit ( loss) A business has: Selling price = $50 per unit Variable cost = $30 per unit Fixed costs = $20,000Units sold = 1,400 |
| Formula 1 | Profit = (1400 X $ 50) – ( $ 20, 000 +$ 42, 000) = $ 8000 |
| Formula 2 | Profit = ( 1400 X $20)- $ 20, 000 = $ 8000 |
| Formula 3 | Profit = 400 X $ 20 = $ 8000 |
Key Point: In break-even analysis:
· Contribution first covers fixed costs.
· Once fixed costs are fully covered, any additional contribution becomes profit.
· If contribution is insufficient to cover fixed costs, the business makes a loss.
Target profit output
Target profit output is the number of units a business must sell to achieve a desired level of profit. It helps managers set sales targets and plan production levels.
Unlike the break-even quantity, which results in no profit and no loss, the target profit output includes the desired profit in the calculation.
| Formula: Target profit output (units) = (Fixed costs + Target profit) ÷ Unit contribution Where: Unit Contribution = Selling price per unit − Variable cost per unit |
Assumptions of Break-even Analysis
Break-even analysis is based on several assumptions that simplify real business situations. These assumptions help in calculating the break-even point but may not always reflect reality.
· Selling price remains constant: The selling price per unit does not change, regardless of the number of units sold.
· Variable cost per unit remains constant: The variable cost of producing each unit remains the same at all levels of output.
· Fixed costs remain unchanged: Fixed costs do not vary within the relevant range of production.
· All units produced are sold: It assumes there is no closing inventory and that production equals sales.
· The business produces a single product (or a constant sales mix): For businesses selling multiple products, the proportion of each product sold remains constant.
· Production efficiency remains constant: Labour productivity, technology, and production methods do not change during the period of analysis.
Benefits of break-even analysis
· Supports decision-making: Helps managers decide whether a new product, project, or investment is financially viable.
· Assists pricing decisions: Shows how changes in selling price affect the break-even point and profitability.
· Helps with profit planning: Enables businesses to calculate the sales required to achieve a target profit.
· Supports cost control: Highlights the impact of fixed and variable costs, helping managers identify opportunities to reduce costs.
· Measures business risk: The margin of safety shows how much sales can fall before the business starts making a loss.
Limitations of break-even analysis
· Based on assumptions: Assumes selling price, costs, and output remain constant, which may not be realistic.
· Ignores external factors: Does not consider changes in market demand, competition, inflation, or economic conditions.
· Limited use for multiple products: Becomes less accurate when a business sells several products with different selling prices and contribution margins.
Quick Recap
1. Break-even analysis is a financial tool used to determine the level of sales at which total revenue equals total costs, resulting in no profit and no loss.
2. Fixed costs remain constant regardless of the level of production, while variable costs change directly with the level of output.
3. Total cost is the sum of fixed costs and total variable costs.
4. Unit contribution is the amount each unit sold contributes towards covering fixed costs and generating profit ( Formula: Unit Contribution = Selling Price per Unit − Variable Cost per Unit)
5. Total contribution is the total amount available to cover fixed costs and earn profit.( Formula: Total Contribution = Unit Contribution × Units Sold)
6. Break-even quantity is the number of units a business must sell to cover all its costs. ( Formula: Break-even Quantity = Fixed Costs ÷ Unit Contribution )
7. Margin of safety measures how much sales can fall before the business reaches the break-even point. A higher margin of safety indicates lower business risk.
8. Target profit output calculates the number of units a business must sell to achieve a desired level of profit. ( Formula: Target Profit Output = (Fixed Costs + Target Profit) ÷ Unit Contribution )
9. Break-even analysis helps businesses with pricing decisions, cost control, profit planning, risk assessment, and evaluating business opportunities.
10. Break-even analysis has limitations because it assumes constant selling prices, costs, and production efficiency, and it is less suitable for businesses producing multiple products.
Frequently Asked Questions (FAQs) About Break-Even Analysis
1.What is break-even analysis in simple words?
Break-even analysis tells you how many units a business must sell just to cover its costs. Sell fewer and you lose money. Sell more and every extra unit adds to profit. Managers use it before launching a product, setting a price or deciding whether a new project is worth the risk.
2. How do you calculate the break-even point?
Divide your fixed costs by the unit contribution, which is the selling price minus the variable cost per unit. Say fixed costs are $20,000, the price is $50 and the variable cost is $30. Your contribution is $20 per unit, so you break even at 1,000 units. Selling the 1,001st unit is your first bit of profit.
3. What is the margin of safety, and why does it matter?
The margin of safety is how far your actual sales are above the break-even point. If you sell 1,400 units and break even at 1,000, your margin of safety is 400 units. It shows how much sales can drop before you start making a loss, so a bigger margin means less risk. In IB exams, always mention this when you evaluate a business’s position.
4. How can a business lower its break-even point?
There are three routes. Raise the selling price, cut the variable cost per unit (cheaper suppliers, less waste), or reduce fixed costs like rent and admin salaries. Each one either increases the contribution per unit or shrinks the amount you need to recover. Be careful with price rises though, because demand may fall.
5. What are the limitations of break-even analysis?
It assumes price, variable cost per unit and fixed costs never change, which rarely happens in real life. It also says nothing about demand. Knowing you must sell 1,000 units doesn’t mean customers will actually buy them. It works best for single-product businesses and gets messy when a firm sells many products at different prices.