

Table of Contents
Meaning of decision tree diagram
A decision tree diagram is a decision-making tool that helps businesses evaluate different alternatives by considering possible outcomes, their probabilities, and the expected financial returns (Expected Monetary Value – EMV). It supports managers in making more informed decisions under conditions of uncertainty.
Features of a decision tree diagram
1. Decision Node (□) – Represents the point where a choice between different alternatives is made.
2. Chance Node (○) – Represents uncertain events with different possible outcomes.
3. Branches – Show the available decision options and the possible outcomes of each decision.
4. Probabilities – Each uncertain outcome is assigned a probability, which must add up to 1.0 (100%) at every chance node.
5. Payoffs and EMV – Displays the financial gains or losses for each outcome and enables the calculation of the Expected Monetary Value (EMV).
Advantages and disadvantages of a decision tree diagram
| Advantages | Disadvantages |
| 1. Improves decision-making by comparing different alternatives logically.· 2. Considers risk and uncertainty through the use of probabilities.· 3. Provides a visual representation that is easy to understand and communicate.· 4. Supports financial analysis by calculating the Expected Monetary Value (EMV).· 5. Encourages systematic thinking by considering all possible outcomes before making a decision. | 1. Probabilities may be inaccurate, making the results unreliable if estimates are poor.· 2. Ignores qualitative factors such as employee morale, brand image, customer loyalty, or ethical considerations.· 3. Can become complex and time-consuming when there are many decision options and possible outcomes. |
Decision-tree diagram example
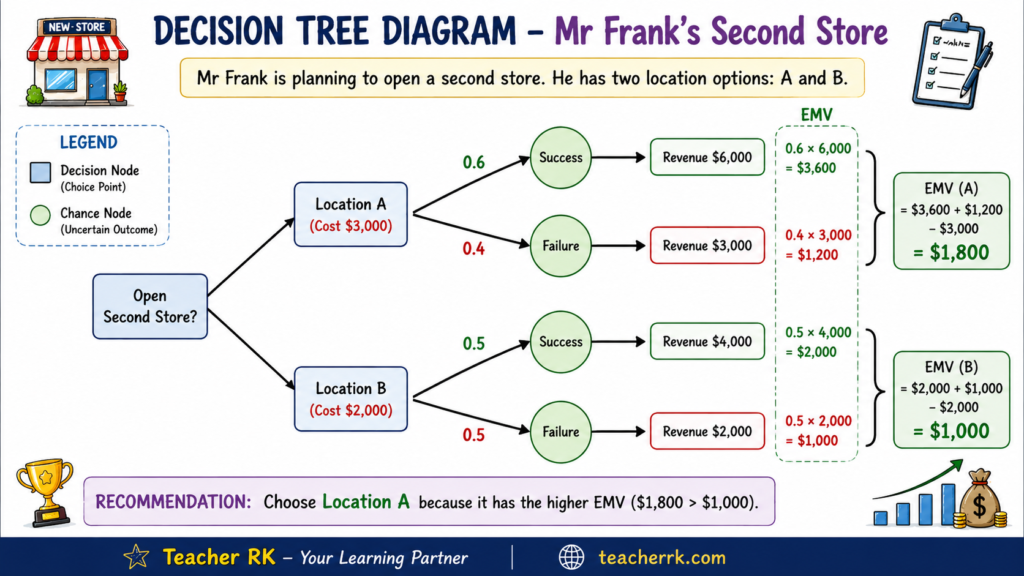
Mr Frank runs a successful business. He is planning to open a second store. He has two locations A and B. Other details are given below:
| Options | Cost ($) | Probability of success and expected revenue | Probability of failure and expected revenue |
| Option 1: Location A | $ 3000 | 0.6$ 6000 | 0.4$ 3000 |
| Option 2: Location B | $ 2000 | 0.5$ 4000 | 0.5$ 2000 |
Task: Construct a decision tree diagram, calculate the Expected Monetary Value (EMV) for each option, and recommend the best location for Mr. Frank. Justify your recommendation.
Final tip: A decision tree should not be used in isolation. Managers should combine the EMV with qualitative factors such as market conditions, competition, customer preferences, legal issues, and the business’s objectives before making the final decision.