
Table of Contents
Introduction
Financial ratios are tools used to analyze and interpret a business’s financial performance and financial position. By comparing figures from the Income Statement and Statement of Financial Position, ratios help managers, investors, lenders, and other stakeholders evaluate the efficiency, Profitability and liquidity ratio.
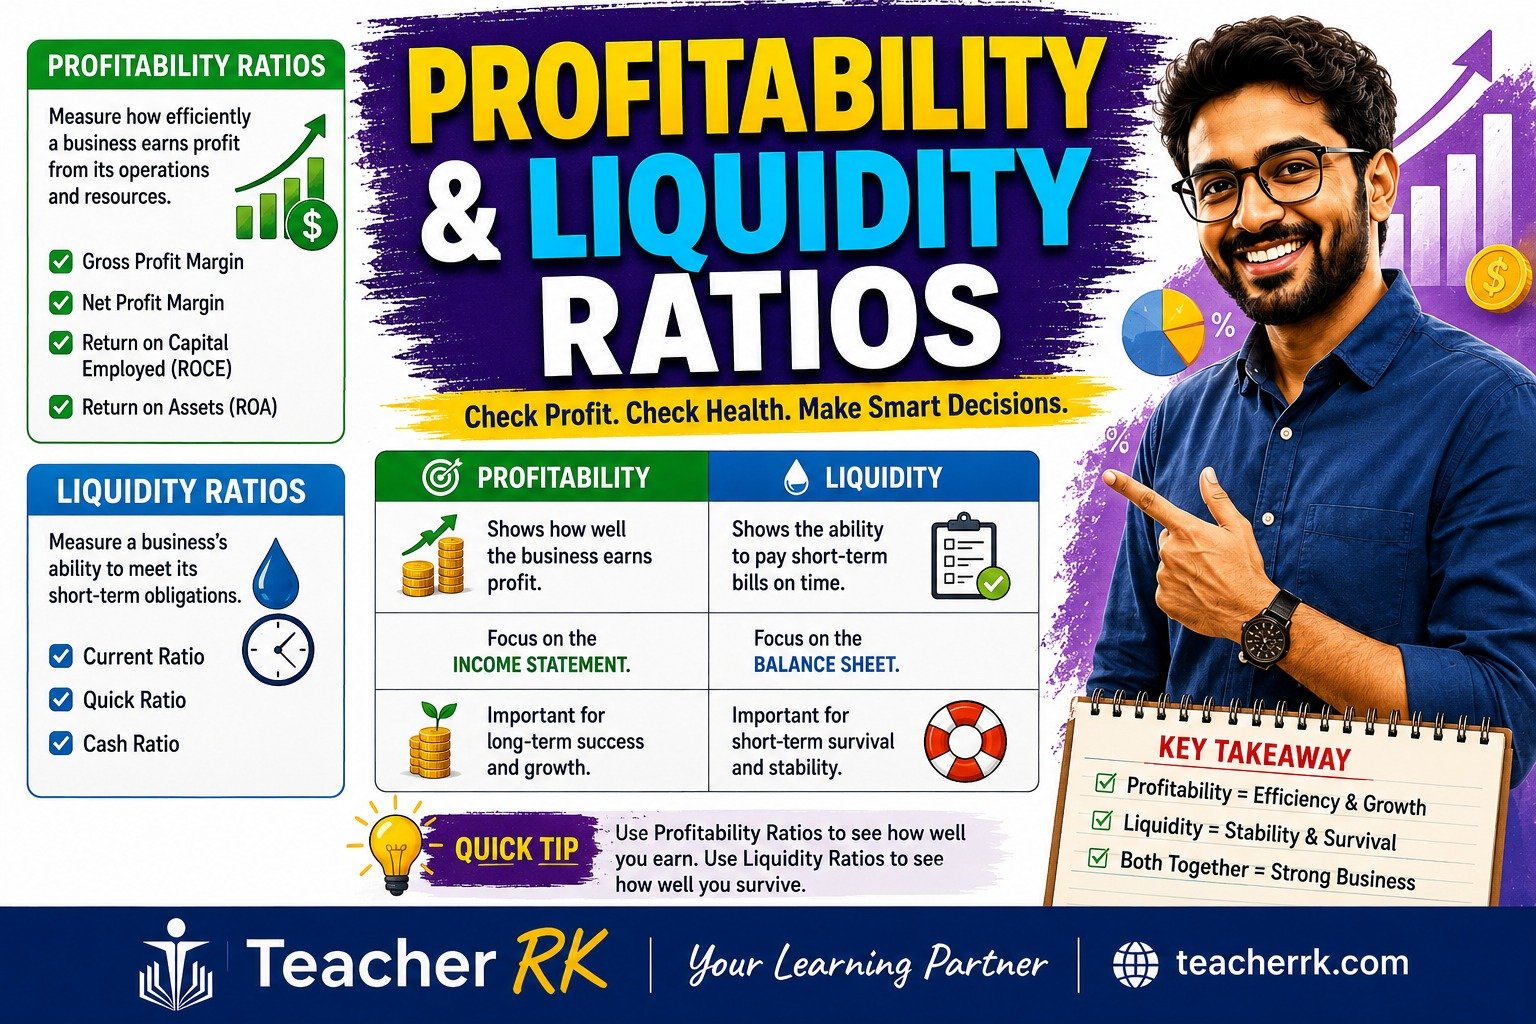
Two important categories of financial ratios are profitability ratios and liquidity ratios.
- Profitability ratios measure a business’s ability to generate profit.
- Liquidity ratios measure a business’s ability to meet its short-term financial obligations.
Profitability Ratios
1. Gross Profit Margin
Meaning : The Gross Profit Margin measures the percentage of sales revenue that remains after deducting the cost of goods sold. It indicates how efficiently a business manages its production or purchasing costs.
| Formula: Gross Profit Margin (%) = (Gross Profit ÷ Sales Revenue) × 100 |
2. Profit Margin
Meaning: The Profit Margin measures the percentage of sales revenue that remains as net profit after all expenses have been deducted.
| Formula: Profit Margin (%) = ( Profit before Interest and Tax ÷ Sales Revenue) × 100 |
3. Return on Capital Employed (ROCE)
Meaning: ROCE measures how efficiently a business uses its capital to generate profits.
| Formula: ROCE (%) = ( Profit before Interest and Tax ÷ Capital Employed) × 100 |
Liquidity Ratios
Current Ratio
Meaning: The Current Ratio measures the ability of a business to meet its short-term liabilities using its current assets.
| Formula: Current Ratio = Current Assets ÷ Current Liabilities |
Acid-Test Ratio (Quick Ratio)
Meaning: The Acid-Test Ratio, also known as the Quick Ratio, measures a business’s ability to meet short-term liabilities using its most liquid assets.
Unlike the current ratio, inventory is excluded because it may not be converted into cash quickly.
| Formula: Acid-Test Ratio = (Current Assets – Inventory) ÷ Current Liabilities |
Benefits of Ratio Analysis
- Measures business performance: Ratios help evaluate the profitability, Efficiency and Gearing Ratios, and liquidity of a business.
- Supports decision-making: Managers can use ratio analysis to identify strengths and weaknesses and make informed decisions.
- Facilitates comparison: Ratios allow comparisons between businesses, industries, and different accounting periods.
- Assists investors and lenders: Investors and financial institutions use ratios to assess risk and financial health before investing or lending.
- Identifies trends: Ratio analysis helps detect changes and trends in business performance over time.
Limitations of Ratio Analysis
- Based on historical data: Ratios are calculated using past financial information, which may not reflect future performance.
- Ignores qualitative factors: Ratios do not consider factors such as employee morale, brand reputation, or customer satisfaction.
- Can be misleading: Different accounting policies and methods may make comparisons difficult.
- Limited use in isolation: A single ratio provides limited insight and should be interpreted alongside other financial information.
- Affected by external factors: Economic conditions, inflation, and industry changes can influence ratio results and reduce comparability.
Ratio analysis summary table
| Gross profit margin | Gross Profit Margin (%) = (Gross Profit ÷ Sales Revenue) × 100 |
| Profit margin | Profit Margin (%) = (Profit before Interest and Tax ÷ Sales Revenue) × 100 |
| ROCE | ROCE (%) = (Profit before Interest and Tax ÷ Capital Employed) × 100 |
| Current ratio | Current Ratio = Current Assets ÷ Current Liabilities |
| Acid-test(Quick) ratio | Acid-Test Ratio = (Current Assets – Inventory) ÷ Current Liabilities |
Quick Recap
10 Things to Remember
1. Financial ratios are tools used to evaluate a business’s financial performance and financial position using information from the Income Statement and Statement of Financial Position.
2. Profitability ratios measure a business’s ability to generate profit, while liquidity ratios measure its ability to meet short-term financial obligations.
3. Gross Profit Margin measures the percentage of sales revenue remaining after deducting the cost of goods sold.
Formula: (Gross Profit ÷ Sales Revenue) × 100
4. Profit Margin measures the percentage of sales revenue remaining as profit before interest and tax (PBIT).
Formula: (PBIT ÷ Sales Revenue) × 100
5. Return on Capital Employed (ROCE) measures how efficiently a business uses its capital to generate profits.
Formula: (PBIT ÷ Capital Employed) × 100
6. Current Ratio measures a business’s ability to pay its short-term liabilities using its current assets. Formula: Current Assets ÷ Current Liabilities
7. Acid-Test (Quick) Ratio measures short-term liquidity using only the most liquid assets by excluding inventory. Formula: (Current Assets − Inventory) ÷ Current Liabilities
8. Ratio analysis helps businesses measure performance, support decision-making, compare performance, assess financial health, and identify trends over time.
9. Ratio analysis has limitations because it is based on historical data, ignores qualitative factors, may be affected by different accounting methods, and should not be interpreted in isolation.
10. Financial ratios are most useful when compared with previous years, competitors, industry averages, or business targets.